
Correlation matrix: how measured variables move together
When several things were measured on the same samples — four flower dimensions, six sensory scores, a panel of chemistry — the first question is which move together. A correlation matrix gives every pairwise correlation coefficient with its p-value: r near ±1 means the two track each other almost exactly, near 0 that they are unrelated.
The data
One row per sample, one column per variable (the four iris measurements, cm):
| Sample | Sepal length | Sepal width | Petal length | Petal width |
|---|---|---|---|---|
| 1 | 5.1 | 3.5 | 1.4 | 0.2 |
| 2 | 4.9 | 3.0 | 1.4 | 0.2 |
| … | … | … | … | … |
| 150 | 5.9 | 3.0 | 5.1 | 1.8 |
Matrix layout: samples down, variables across — the same shape PCA, PLS and the heatmap use.
In MinutePlot
Choose Correlation matrix, paste the table, run. Pearson’s r is the default (Spearman and Kendall are options for ranked or non-linear relationships); the figure colours each cell by its coefficient and the table beneath gives r and p for every pair.
The result
Petal length and petal width: r = 0.96, p < 0.001; sepal length and petal length: r = 0.87. Sepal width stands apart (r = −0.12 with sepal length, p = 0.15, not significant). Three of the four dimensions largely measure one thing — flower size — which is exactly what PCA finds next.
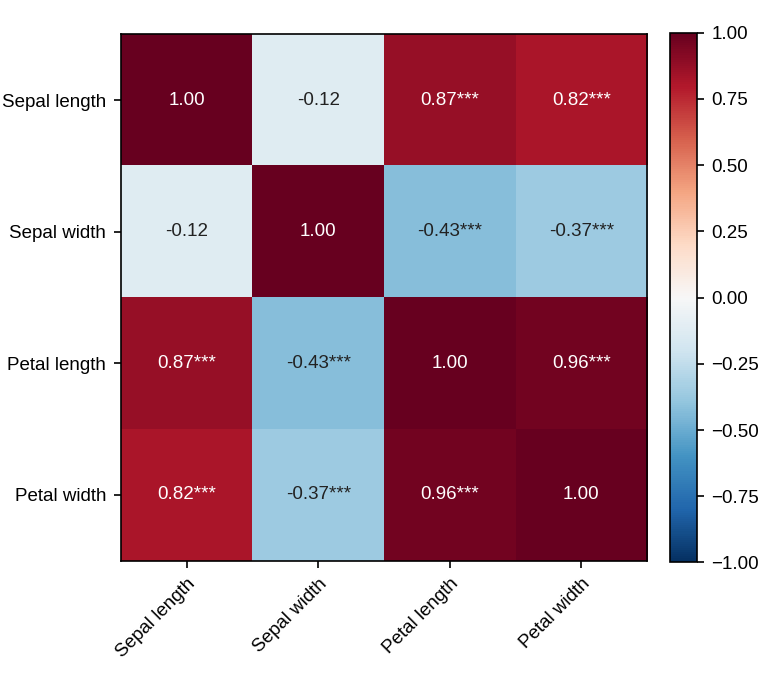
The figure MinutePlot produces: every pairwise coefficient as a colour, red positive and blue negative, with the value printed in each cell.
Styling and exporting this figure: see Figure styling and Exporting & downloading.
Report it like this
“Petal length correlated strongly with petal width (Pearson r = 0.96, p < 0.001) and sepal length (r = 0.87, p < 0.001); sepal width was not correlated with sepal length (r = −0.12, p = 0.15).”
- Pearson, K. (1895). Notes on regression and inheritance in the case of two parents. Proceedings of the Royal Society of London, 58, 240–242.