
Three-way ANOVA: three crossed factors
Vary three factors in a full factorial — nitrogen, phosphate and potassium each present or absent, every combination grown — and three-way ANOVA tests seven effects at once: the three main effects, the three pairwise interactions, and whether the three factors interact jointly. MinutePlot’s design is fully crossed and between-subjects: every combination of levels is its own group of replicates.
The data
Pea yield (lb per plot) with N, P and K each 0 or 1, three plots per combination (the classic npk experiment, blocks omitted):
| K0 | K1 | |||||
|---|---|---|---|---|---|---|
| r1 | r2 | r3 | r1 | r2 | r3 | |
| N0 · P0 | 46.8 | 51.5 | 56.0 | 55.5 | 55.0 | 45.5 |
| N0 · P1 | 56.0 | 62.8 | 44.2 | 49.5 | 48.8 | 53.2 |
| N1 · P0 | 59.8 | 69.5 | 62.0 | 57.0 | 49.8 | 57.2 |
| N1 · P1 | 62.8 | 52.0 | 59.0 | 58.5 | 55.8 | 48.8 |
r = replicate: r1 is replicate 1, r2 replicate 2, and so on.
Three-factor layout: factors A and B combined down the rows, factor C across grouped columns, replicates within each cell.
In MinutePlot
Choose Three-way ANOVA, fill the template (or paste a table in this shape), and run. The ANOVA table lists all seven terms; the pairwise comparisons and letters are on the cell means (Tukey HSD), and each cell carries a compound label — capitals for factor A, lower-case for B and a digit for C — plus one plain letter set over all cells.
The result
Nitrogen is the one clear effect (F(1, 16) = 6.16, p = 0.025); phosphate, potassium and every interaction are not significant here, and no two cells differ after Tukey adjustment. That is the honest reading of a small factorial: strong evidence for one factor, none for the rest.
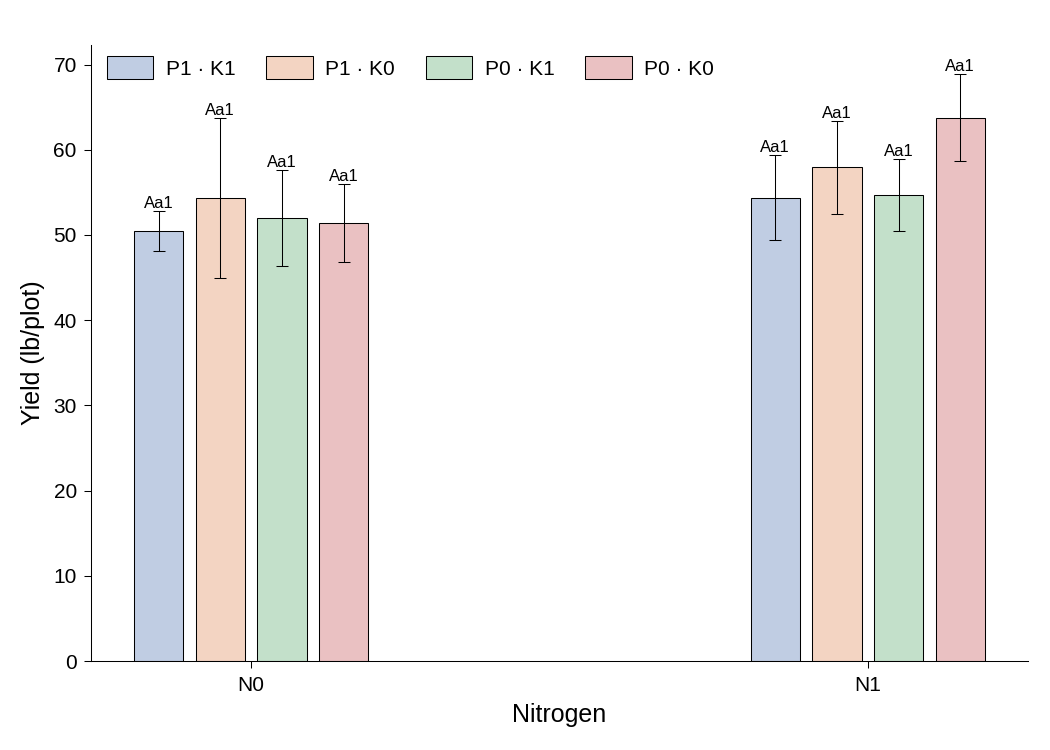
The figure MinutePlot produces: nitrogen along the axis, one bar per phosphate × potassium combination, error bars, and the compound letters on every cell.
Styling and exporting this figure: see Figure styling and Exporting & downloading.
Report it like this
“Yield increased with nitrogen (F(1, 16) = 6.16, p = 0.025); phosphate, potassium and their interactions had no significant effect (all p > 0.09).”
- Montgomery, D. C. (2017). Design and Analysis of Experiments (9th ed.). John Wiley & Sons.
- Tukey, J. W. (1949). Comparing individual means in the analysis of variance. Biometrics, 5(2), 99–114.