
Dose-response regression: the EC50 from a sigmoid curve
Root growth falling with the concentration of an inhibitor, a signal rising with the concentration of an analyte: responses to a dose series are usually sigmoid on a log-dose axis, with a lower and an upper plateau and a steep middle. The four-parameter logistic (4PL) describes that curve with the two plateaus, the slope, and the EC50 — the dose giving the half-way response — which is normally the number you are after.
The data
Root length (cm) of ryegrass at seven concentrations of ferulic acid (mM), including untreated controls at 0 (the ryegrass data of the drc package):
| Dose | r1 | r2 | r3 | r4 | r5 | r6 |
|---|---|---|---|---|---|---|
| 0 | 7.58 | 8.00 | 8.33 | 7.25 | 7.60 | 7.87 |
| 0.94 | 8.14 | 7.87 | 7.62 | |||
| 1.88 | 7.21 | 7.79 | 7.32 | |||
| 3.75 | 4.52 | 3.84 | 2.69 | |||
| 7.5 | 2.44 | 1.83 | 1.87 | |||
| 15 | 0.61 | 1.09 | 0.85 | |||
| 30 | 0.56 | 0.72 | 0.55 |
r = replicate: r1 is replicate 1, r2 replicate 2, and so on.
Dose-response layout: one row per dose, replicates across. Zero-dose controls are included in the fit.
In MinutePlot
Choose Regression, model 4PL (dose-response), paste the table, run. The curve is fitted on the dose scale (so dose 0 sits on the upper plateau of a falling curve), and the table reports the lower and upper asymptotes, the slope and the EC50, each with a standard error and confidence interval.
The result
EC50 = 3.06 mM (95 % CI 2.67–3.45); upper plateau 7.79 cm, lower plateau 0.48 cm, slope 2.98 — the same fit R’s drc package gives on this data. Half the growth is lost at about 3 mM.
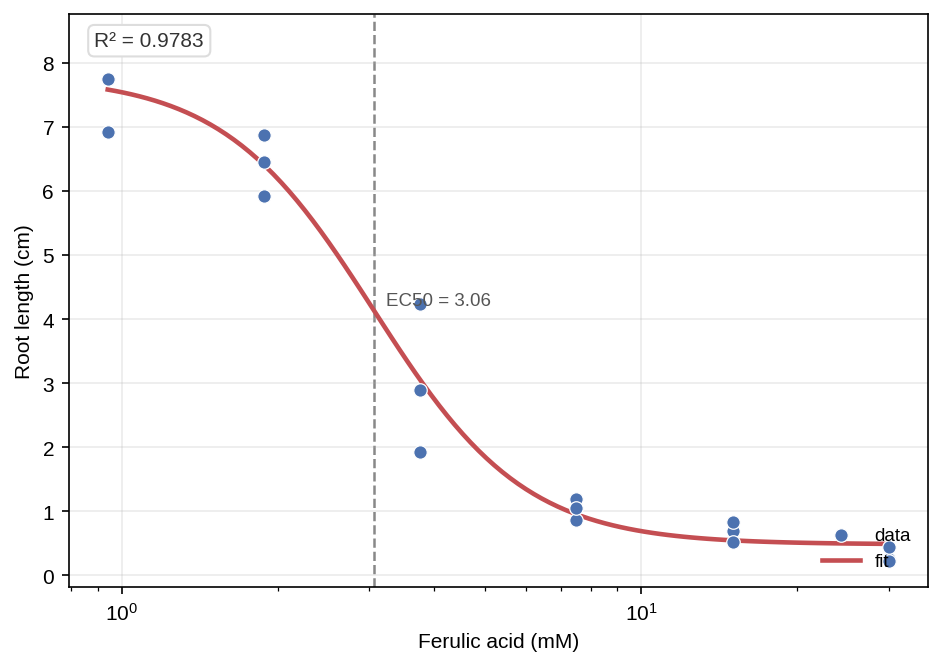
The figure MinutePlot produces: the data on a log-dose axis, the fitted four-parameter curve, and the EC50 marked with R² in the corner.
Styling and exporting this figure: see Figure styling and Exporting & downloading.
Report it like this
“Root length followed a four-parameter logistic dose-response (EC50 = 3.06 mM, 95 % CI 2.67–3.45; upper plateau 7.79 cm, lower plateau 0.48 cm).”
- Ritz, C., Baty, F., Streibig, J. C. & Gerhard, D. (2015). Dose-response analysis using R. PLoS ONE, 10, e0146021.