
Repeated-measures ANOVA: a worked example
When the same subjects are measured repeatedly — six plants, each measured on days 0, 7 and 14 — the measurements are not independent, and ordinary one-way ANOVA is the wrong tool: it treats 18 numbers as 18 unrelated observations. Repeated-measures ANOVA instead removes the differences between subjects first, then asks whether values change across time — which makes it considerably more powerful, because each plant serves as its own control.
The data
Leaf area (cm²) of six plants tracked over two weeks:
| Timepoints | |||
|---|---|---|---|
| Day 0 | Day 7 | Day 14 | |
| Plant 1 | 5.0 | 6.1 | 7.2 |
| Plant 2 | 4.8 | 5.9 | 7.0 |
| Plant 3 | 5.3 | 6.4 | 7.6 |
| Plant 4 | 5.1 | 6.0 | 7.1 |
| Plant 5 | 4.9 | 6.2 | 7.3 |
| Plant 6 | 5.2 | 6.3 | 7.4 |
The repeated-measures layout: one row per subject, one column per timepoint — exactly how MinutePlot expects it.
The result
Time: F(2, 10) = 189.5, p < 0.001. The post-hoc letters separate all three timepoints — Day 0 (5.05, c), Day 7 (6.15, b), Day 14 (7.27, a): leaf area grew significantly in each week.
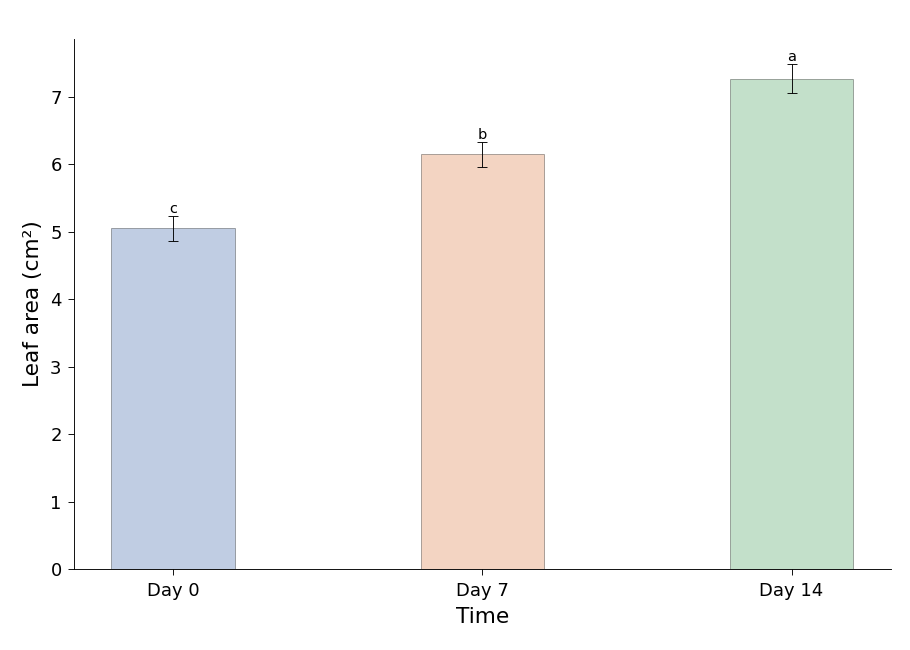
Means across timepoints with letters — all three differ.
Styling and exporting this figure: see Figure styling and Exporting & downloading.
Report it like this
“Leaf area increased over time (repeated-measures ANOVA, F(2, 10) = 189.5, p < 0.001); all timepoints differed from one another (p < 0.05, letters in Fig. 1).”
Common pitfalls
Entering repeated data as if the groups were independent is the classic error — it discards the design’s power and can bias p-values in either direction. In MinutePlot, choose the repeated-measures layout so each row is a subject; the engine then handles the within-subject structure for you.
- Shapiro, S. S., & Wilk, M. B. (1965). An analysis of variance test for normality (complete samples). Biometrika, 52(3–4), 591–611. https://doi.org/10.1093/biomet/52.3-4.591
- Montgomery, D. C. (2017). Design and Analysis of Experiments (9th ed.). John Wiley & Sons.