
Paired t-test: the same subjects measured twice
When every subject is measured under both conditions — the same ten patients before and after a treatment, the same twelve loaves scored by two panels — the two values belong together. A paired t-test works on the differences within each pair, which removes the subject-to-subject spread that an independent test would have to fight through.
The data
Extra sleep (hours) under two drugs for the same ten patients (R’s classic sleep data): one row per condition, one column per subject.
| r1 | r2 | r3 | r4 | r5 | r6 | r7 | r8 | r9 | r10 | |
|---|---|---|---|---|---|---|---|---|---|---|
| Drug 1 | 0.7 | −1.6 | −0.2 | −1.2 | −0.1 | 3.4 | 3.7 | 0.8 | 0.0 | 2.0 |
| Drug 2 | 1.9 | 0.8 | 1.1 | 0.1 | −0.1 | 4.4 | 5.5 | 1.6 | 4.6 | 3.4 |
r = replicate: r1 is replicate 1, r2 replicate 2, and so on.
Paired layout: the same subject occupies the same column in both rows — column r1 is patient 1 under each drug.
In MinutePlot
Choose t-test (paired), paste the two rows, and run. MinutePlot pairs the columns, tests the mean difference, and reports the effect size (Hedges’ g with its confidence interval) alongside t, df and p.
The result
t(9) = −4.06, p = 0.003: drug 2 gives about 1.6 hours more sleep than drug 1 in the same patients. An independent t-test on the same numbers gives p = 0.08 — the pairing is what finds the effect.
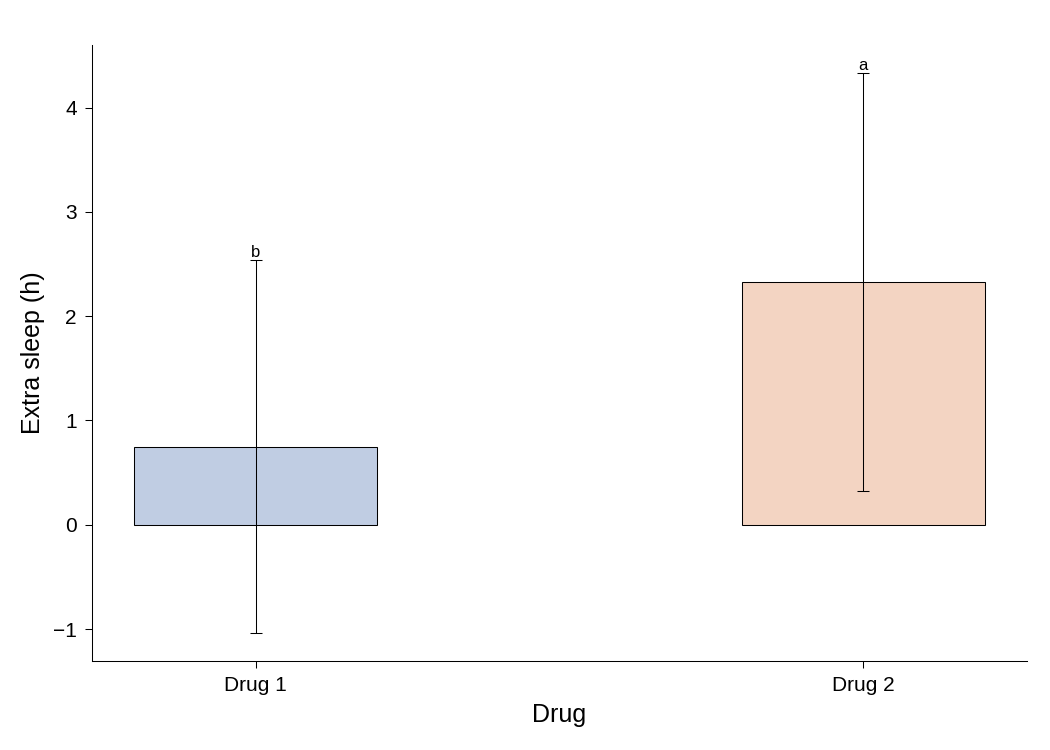
The figure MinutePlot produces for this analysis: the two drug means with error bars and the letters marking their difference.
Styling and exporting this figure: see Figure styling and Exporting & downloading.
Report it like this
“Sleep gain differed between the drugs in the same patients (paired t-test, t(9) = −4.06, p = 0.003; mean difference 1.58 h).”
- Student (1908). The probable error of a mean. Biometrika, 6(1), 1–25. https://doi.org/10.1093/biomet/6.1.1
- Shapiro, S. S., & Wilk, M. B. (1965). An analysis of variance test for normality (complete samples). Biometrika, 52(3–4), 591–611. https://doi.org/10.1093/biomet/52.3-4.591