
Two-way repeated-measures ANOVA: two within-subject factors
Eight subjects each tested at two intensities (Low, High) and three times (T1, T2, T3) — six measurements per subject. Both factors are within-subject: every subject appears in every cell. MinutePlot tests each effect against its own error term (A against A×Subject, B against B×Subject, A×B against A×B×Subject), the standard univariate formulation.
The data
One row per subject, the A×B combinations across the columns:
| Low | High | |||||
|---|---|---|---|---|---|---|
| Subject | T1 | T2 | T3 | T1 | T2 | T3 |
| S1 | 48.6 | 50.9 | 53.4 | 52.8 | 55.6 | 59.9 |
| S2 | 52.1 | 54.0 | 56.9 | 56.3 | 58.7 | 63.0 |
| … | … | … | … | … | … | … |
| S8 | 45.9 | 48.3 | 51.0 | 49.7 | 52.4 | 57.2 |
Two-within layout: subjects down the rows; factor A as column blocks, factor B within each block. Every cell holds exactly one value per subject.
In MinutePlot
Choose Two-way repeated-measures ANOVA, paste the table, run. Mauchly’s test is reported for every effect with more than two levels; when sphericity is rejected the Greenhouse–Geisser correction is applied and both p-values are shown.
The result
On the validation dataset behind this guide: intensity F(1, 7) = 371.9, p < 0.001; time F(2, 14) = 94.5, p < 0.001 (ε = 0.76, corrected p still < 0.001); the interaction just short of significance (F(2, 14) = 3.60, p = 0.055).
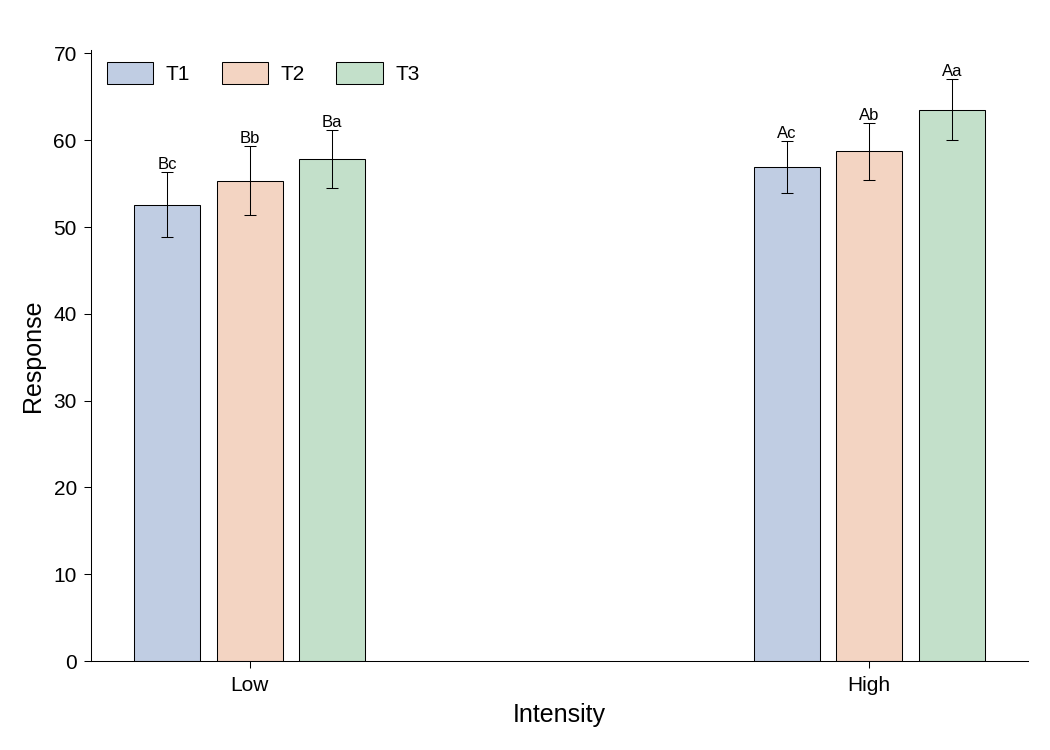
The figure MinutePlot produces: intensity along the axis, one bar per time, error bars, and the compound letters (capitals across intensity, lower-case across time).
Styling and exporting this figure: see Figure styling and Exporting & downloading.
Report it like this
“Intensity (F(1, 7) = 371.9, p < 0.001) and time (F(2, 14) = 94.5, Greenhouse–Geisser p < 0.001) affected the response; their interaction did not reach significance (F(2, 14) = 3.60, p = 0.055).”
- Greenhouse, S. W. & Geisser, S. (1959). On methods in the analysis of profile data. Psychometrika, 24, 95–112.
- Mauchly, J. W. (1940). Significance test for sphericity of a normal n-variate distribution. Annals of Mathematical Statistics, 11, 204–209.