
Two-way ANOVA and interactions: a worked example
When an experiment varies two factors — here fertiliser (Control / High N) and watering (Daily / Weekly) — two-way ANOVA tests three things in one analysis: each factor’s main effect, and whether the factors interact: does the effect of one depend on the level of the other? The interaction is usually the scientifically interesting part.
The data
Grain yield (g per pot), four pots per combination:
| Daily | Weekly | |||||||
|---|---|---|---|---|---|---|---|---|
| r1 | r2 | r3 | r4 | r1 | r2 | r3 | r4 | |
| Control | 42.1 | 40.8 | 43.0 | 41.5 | 38.2 | 37.5 | 39.1 | 38.8 |
| High N | 52.3 | 53.1 | 51.6 | 52.8 | 44.9 | 45.8 | 44.1 | 45.3 |
r = replicate: r1 is replicate 1, r2 replicate 2, and so on.
MinutePlot’s two-factor layout: factor A down the rows, factor B across grouped columns, replicates within each group.
The result
Fertiliser: F(1, 12) = 512.5, p < 0.001. Watering: F(1, 12) = 204.3, p < 0.001. Interaction: F(1, 12) = 27.3, p < 0.001. The interaction says the fertiliser benefit depends on watering: under daily watering, High N adds about 10.6 g over the control; under weekly watering only 6.6 g. Reporting the two main effects alone would miss the real story — nitrogen pays best when water is not limiting.
Two-tier letters
With two factors, MinutePlot letters each dimension separately: capitals compare fertilisers within a watering level, lower-case compares watering within a fertiliser. The four cells here read Aa, Ab, Ba, Bb — every comparison significant, in one compact annotation.
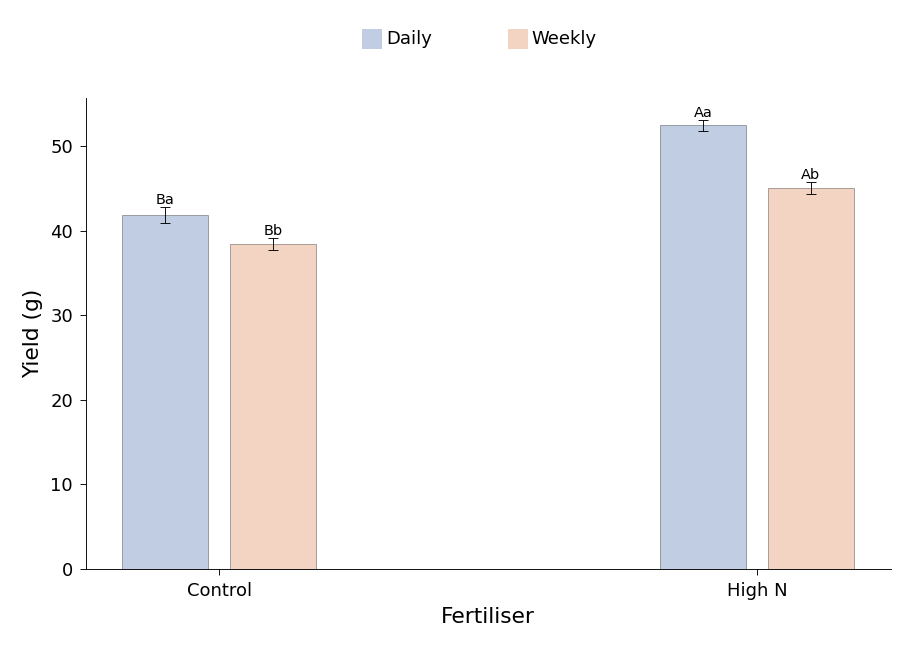
The grouped figure MinutePlot produces: both factors, error bars, and the two-tier letters placed automatically.
Styling and exporting this figure: see Figure styling and Exporting & downloading.
Report it like this
“Yield was affected by fertiliser (F(1, 12) = 512.5, p < 0.001), watering (F(1, 12) = 204.3, p < 0.001), and their interaction (F(1, 12) = 27.3, p < 0.001): the benefit of High N was larger under daily than weekly watering.”
- Tukey, J. W. (1949). Comparing individual means in the analysis of variance. Biometrics, 5(2), 99–114.
- Shapiro, S. S., & Wilk, M. B. (1965). An analysis of variance test for normality (complete samples). Biometrika, 52(3–4), 591–611. https://doi.org/10.1093/biomet/52.3-4.591
- Montgomery, D. C. (2017). Design and Analysis of Experiments (9th ed.). John Wiley & Sons.