
Two-way mixed ANOVA: groups of subjects measured over time
Two groups of subjects — control and treated — each measured at three times. Group is a between-subjects factor (a subject is in one group only); time is within-subject (every subject is measured at every time). MinutePlot fits the univariate split-plot ANOVA: group is tested against subjects within groups, time and group×time against the within-subject error.
The data
One row per subject, the group in the first column, the times across:
| Subject | Group | T1 | T2 | T3 |
|---|---|---|---|---|
| C1 | Control | 49.2 | 51.4 | 53.1 |
| C2 | Control | 47.8 | 50.0 | 52.5 |
| … | … | … | … | … |
| T1 | Treated | 52.6 | 55.1 | 59.4 |
| T8 | Treated | 51.0 | 53.7 | 58.2 |
Mixed layout: subjects down the rows, their group in a label column, the within-subject levels across.
In MinutePlot
Choose Two-way mixed ANOVA, paste the table, run. Mauchly’s test is computed on the repeated-measures covariance pooled within the groups (the standard mixed-design formulation), and the Greenhouse–Geisser correction is applied to the within-subject effects when needed.
The result
On the validation dataset behind this guide: time F(2, 28) = 83.8, p < 0.001; group×time F(2, 28) = 7.17, p = 0.003 (the treated group climbs faster); the group main effect on its own does not reach significance (F(1, 14) = 4.19, p = 0.060). The interaction is the finding: the treatment shows up as a steeper rise, not a uniform offset.
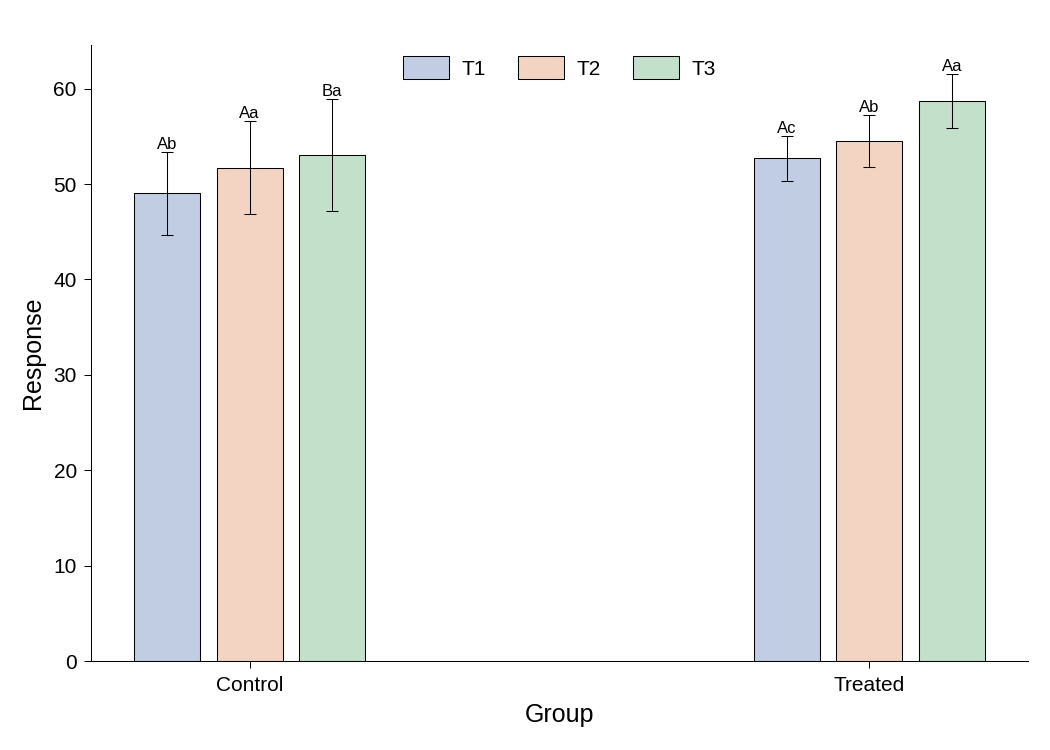
The figure MinutePlot produces: the two groups along the axis, one bar per time; the steeper rise in the treated group is the interaction.
Styling and exporting this figure: see Figure styling and Exporting & downloading.
Report it like this
“The response rose over time (F(2, 28) = 83.8, p < 0.001), more steeply in the treated group (group×time F(2, 28) = 7.17, p = 0.003).”
- Greenhouse, S. W. & Geisser, S. (1959). On methods in the analysis of profile data. Psychometrika, 24, 95–112.
- Mauchly, J. W. (1940). Significance test for sphericity of a normal n-variate distribution. Annals of Mathematical Statistics, 11, 204–209.